

What is No-Demand Inventory
No-demand (ND) inventory refers to the stock of products that a company has on hand but cannot sell due to a lack of customer demand. This can happen for various reasons, such as changes in consumer preferences, economic downturns, or increased competition.
Having a large amount of no-demand inventory can harm a company. First and foremost, it ties up valuable resources, such as capital and storage space, that could be used for other purposes. Additionally, it can lead to increased costs associated with storing and maintaining the inventory, such as rent, utilities, and insurance.
Furthermore, no-demand inventory can have a negative impact on a company’s bottom line. When products are not selling, the company is not generating revenue, which can lead to financial losses. In addition, having a large amount of unsold inventory can lead to discounting or liquidation sales, further eroding profits.
Unfortunately, no-demand inventory is a common issue that businesses face. Businesses have inventory sitting on shelves with no upcoming demand, tying up valuable resources and potentially costing money. This is a serious, complex and time consuming problem that should be addressed promptly to avoid significant financial losses and other negative consequences.
Addressing Inventory Levels
The primary goal of addressing the problem of no-demand inventory is to ensure that a company’s inventory levels align with customer demand. This involves some specific goals and strategies, including:
- Conducting market research: Understand customer preferences and behavior better, which can be achieved through market research to gather data on trends, buying patterns, and other factors influencing demand for a company’s products.
- Streamlining production and distribution: Streamline the production and distribution process to ensure that products are being produced and shipped in response to actual demand. This may involve implementing more flexible production processes or just-in-time inventory management techniques.
- Managing inventory levels effectively: Keep enough stock on hand to meet demand without overstocking and creating excess inventory by setting inventory targets, using inventory management software, and monitoring inventory levels closely.
- Improving forecasting accuracy: By improving demand forecasting accuracy, inventory levels can be adjusted proactively to meet changing customer demand. This can be done by investing in more advanced forecasting tools or working closely with suppliers and other partners to gather data on demand.
Creative Solutions for Managing Excess Inventory
Finding creative ways to use excess inventory to match current demand is an out-of-the-box solution to the problem of no-demand inventory. This approach involves identifying opportunities to modify or repurpose existing inventory to meet customers’ needs.
- Find alternatives for products-Focus on finding alternative uses for these products that align with current customer demand.
- This creative and unconventional approach requires matching excess inventory’s geometric design and technical specifications with currently-demand products. Carefully compare each part’s technical drawings and long descriptions, looking for similarities and overlaps that indicate a potential match. If we find parts with the same drawing number and description, we can create a work order to convert them to a different part number. To ensure the quality and reliability of these conversions, send an email to the sustaining and quality teams to confirm the conversion. This approach allows us to make the most of our excess inventory while meeting customer demand and reducing the risk of excess inventory buildup.
- Use Database
- Obtain the appropriate database for the no-demand inventory. This is critical in ensuring the accuracy and reliability of the data, as well as establishing the proper table relationships necessary for producing high-quality results.
Key Milestones
It’s important to establish milestones to ensure the acquisition of accurate and complete technical drawings:
- Identify and locate the Technical Drawing database. Ensure the database contains all necessary columns, including Material or Part Number, Material Description, Drawing Number, Drawing Revision, and a key column for filtering plant-related projects.
- Verify the accuracy and completeness of the data in the Technical Drawing database. Establish effective linkages between the Technical Drawing database and other relevant databases in the project to ensure accurate and reliable data analysis.
- Acquire the Material Master database as it contains comprehensive details for each material, including Part Number.
- Integrate the Material Master database with the Technical Drawing database to ensure accurate and complete data for analysis.
- Procure the Pegging report which contains all demand materials with promises, Material Requirements Planning (MRP), and required dates.
- Integrate the Pegging report into the project workflow to provide insights into material demand and planning, facilitating effective decision-making.
- Include the Bill of Materials (BOM) tables in the project database-this provides a comprehensive breakdown of all components and subcomponents required to build the top-level part numbers.
- Use the BOM tables as a pivotal table to initiate lookup across other tables, facilitating the identification of all possible component conversions.
- Integrate the BOM tables with the Technical Drawing and Material Master databases to provide a complete picture of the materials and components involved in the project.
The No-Demand Inventory table contains information about the net inventory levels of materials or products in a company. The table represents inventory levels after considering customer demand. In other words, the ND Inventory table provides a view of the actual inventory by subtracting the inventory level from the demand.
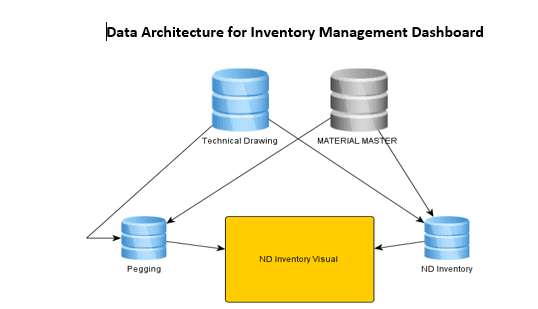
Inventory Management Dashboard
An inventory management dashboard leverages data from several tables, including the Material Master Data Table, Demand Inventory Table, and the Technical Drawing Database. By consolidating data from these sources, the dashboard provides a complete view of inventory levels and demand patterns, allowing businesses to make informed decisions about inventory management.
The Material Master Data Table provides comprehensive details about each material, including its part number, description, and other relevant information. The Demand Inventory Table contains information about the demand for each material, including promises, Material Requirements Planning (MRP), and required dates. The Technical Drawing Database provides technical drawings for each part, including details about the materials needed to manufacture the part.
By combining data from these tables, our inventory management dashboard allows businesses to quickly and easily visualize inventory levels and identify opportunities for conversion. For example, if we have an excess inventory of a particular material, we can identify other parts that require the same material and convert the excess into those parts. This approach helps businesses to reduce waste and save money by optimizing inventory levels.
The dashboard also provides insights into demand patterns, allowing businesses to adjust inventory levels based on changing demand. For example, if we notice that the need for a particular part is increasing, we can adjust our inventory levels to ensure that we can meet customer demand. This approach helps businesses to maintain optimal inventory levels while minimizing the risk of stockouts or overstocking.
By searching using the Top level Part number, the BOM table will display all the BOM components that can be converted along with their matching descriptions and Technical drawings. The table will also show the corresponding quantity and the number of possible options for the conversion.
Success Story: Product Center Implementation
By using the inventory management dashboard for our project, the planning manager can make informed decisions about inventory management before releasing new orders to the shop from the workbench. By checking all the options for any components on the Bill of Materials (BOM) to be converted from the No-Demand (ND) inventory, the planning manager has been able to identify opportunities for conversion and replace the actual Part number with a part number from the ND inventory that matches the description and geometry (Drawing Number).
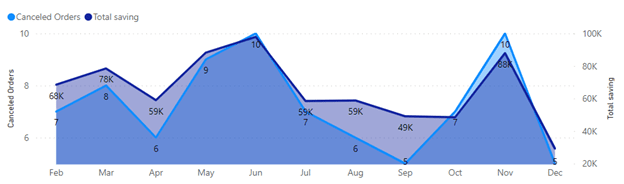
Using this approach, we have optimized our inventory levels and reduced waste. By simulating all new orders in 2023 using the inventory management dashboard, we expect to cancel over 75 component orders, resulting in a total cost savings of over $700k. This demonstrates the effectiveness of the inventory management dashboard in providing real-time insights into inventory levels and demand patterns, facilitating informed decisions that reduce costs and optimize inventory management.
 In conclusion, the successful execution of our project using the inventory management dashboard has resulted in significant cost savings for our company. By leveraging the power of data and making informed decisions about inventory management, we have reduced waste, optimized inventory levels, and remained competitive in today’s fast-paced business environment.
Scaling Data-Driven Inventory Management for Global Implementation
The successful implementation of the inventory management dashboard has resulted in the broader adoption of the tool by the headquarters planning team. The team is now utilizing the dashboard on a larger scale to understand better inventory levels and demand patterns across all manufacturing centers worldwide. By doing so, they can identify opportunities for part number conversion or internal transfers of components, resulting in significant cost savings for the company as a multinational organization.
This expansion of the dashboard’s use enables the company to make informed global inventory management decisions. By leveraging data and analytics, the company can identify opportunities to optimize inventory levels, reduce waste, and save costs across its manufacturing centers worldwide. This demonstrates the effectiveness of the inventory management dashboard in providing real-time insights into inventory levels and demand patterns and facilitating informed decisions that reduce costs and optimize inventory management.
Adopting the inventory management dashboard by the headquarter planning team on a larger scale is a testament to the tool’s effectiveness in providing valuable insights into inventory management. The ability to identify opportunities for part number conversion or internal transfers of components on a global scale has resulted in significant cost savings for the company. By leveraging data and analytics to optimize inventory management, the company can remain competitive and efficient in a rapidly changing business environment.

Vidler Isac, born and raised in Cairo, Egypt, developed a ground-breaking tool that dramatically improves the ordering fulfillment process for oil and gas global manufacturing operations. His solution provides a view of all inventory available across the company and extracts routing hours and materials costs, allows for substitute materials, and updates costs and/or changes routing times. It automates the materials needed to deliver a production order and sends a list to inspection teams with drop dates needed for each component.
Isac began his career in 2007 as a field engineer in western Egypt and was quickly promoted to well services location manager supervising more than 30 employees, including field supervisors, field engineers, and heavy equipment operators.
Recently promoted to Planning Manager for his company’s Houston Product Center, Isac resides in Houston with his family. He holds a Bachelor of Science, Mechanical Engineering degree from the Benha High Institute of Technology (BHIT) at the German Institute for Mechanical.

Oil and gas operations are commonly found in remote locations far from company headquarters. Now, it's possible to monitor pump operations, collate and analyze seismic data, and track employees around the world from almost anywhere. Whether employees are in the office or in the field, the internet and related applications enable a greater multidirectional flow of information – and control – than ever before.