
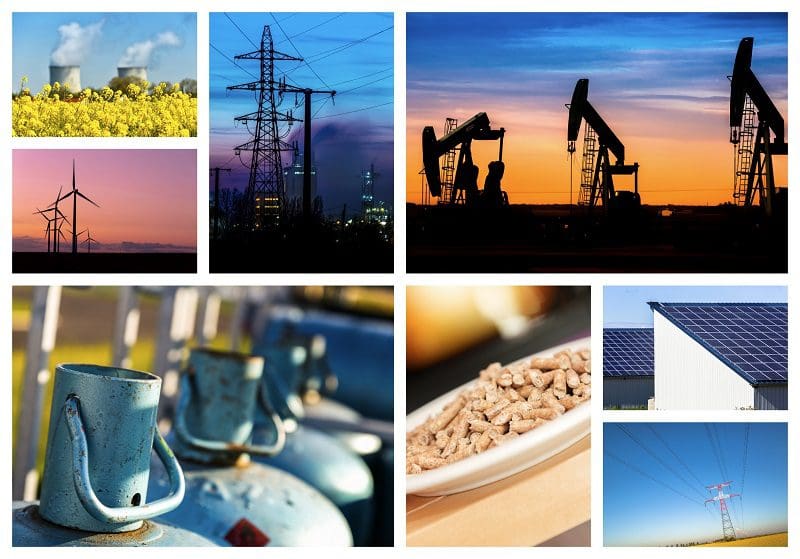
Production of crude oil, natural gas, wind, and solar are expected to set new records in the United States this year, and preliminary numbers indicate each sector is on course.
The Energy Information Administration (EIA) at the Department of Energy released data this week showing U.S. crude oil production averaged 12.5 million barrels per day (b/d) from January to July compared to 11.9 million b/d during the same period last year, the previous record. Add in natural gas liquids for a total field production of 18.7 million b/d compared to 17.5 in 2022.
Dry natural gas production from January to May rose to an average of 15,462 billion cubic feet, surpassing the previous record of 14,494 billion cubic feet during the same period in 2022.
Crude oil and natural gas have been net exporters since 2019, meaning the U.S. has exported more products than it has imported.
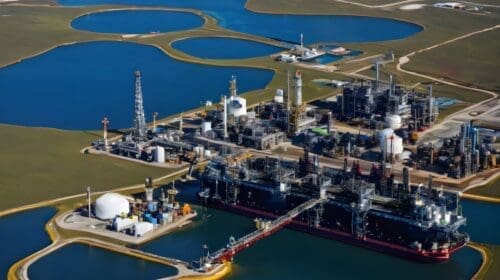
LNG exports from facilities based in Texas and Louisiana continue to grow.
Global liquefied natural gas (LNG) import capacity is set to expand by 16%, or 23 billion cubic feet per day (Bcf/d), by the end of 2024 compared with 2022, according to EIA. In the first seven months of 2023, three countries—Germany, the Philippines, and Vietnam—began importing LNG for the first time. By the end of next year, EIA expects Antigua, Australia, Cyprus, and Nicaragua to start importing LNG.
“Over the past ten years (2013–22), global LNG import capacity—called regasification capacity—has grown by 49% (45.8 Bcf/d) to reach 140.0 Bcf/d across 48 countries,” EIA stated. “By the end of 2024, we expect 55 countries to have LNG regasification terminals with a combined capacity of 163 Bcf/d.”
So far this year, fossil fuels account for 79% of the energy mix compared to 13% for renewables and 8% for nuclear.
Wind became the most significant energy source in the renewable category in 2019, outpacing hydroelectric power, and it has been growing each year. During the first five months, wind consumption in the U.S. was 1,772 trillion British thermal units (Btu) compared to 962 trillion Btu for hydroelectric. Solar consumption was 826 trillion Btu compared to 743 during the same period in 2022.
EIA believes solar and wind will account for 16% of total generation this year, while coal production will decline from 20% to 18%.
In 2022, solar photovoltaic panel shipments in the United States increased 10% from 2021, setting another annual record (31.7 million peak kilowatts [kWp]), according to EIA. Solar panel shipments have been growing as solar capacity continues to rise.
U.S. solar panel shipments include imports, exports, and domestically produced and shipped panels. In 2022, about 88% of U.S. solar panel shipments were imported, primarily from Asia.
Over the past decade, U.S. solar capacity has boomed, including utility-scale solar farms (with one megawatt of capacity or more) and small-scale solar, according to EIA. The majority of small-scale solar is residential rooftop solar installations.
Alex Mills is the former President of the Texas Alliance of Energy Producers.

Alex Mills is the former President of the Texas Alliance of Energy Producers. The Alliance is the largest state oil and gas associations in the nation with more than 3,000 members in 305 cities and 28 states.
- Alex Millshttps://oilmanmagazine.com/author/alex-mills/

- Alex Millshttps://oilmanmagazine.com/author/alex-mills/

- Alex Millshttps://oilmanmagazine.com/author/alex-mills/
- Alex Millshttps://oilmanmagazine.com/author/alex-mills/

- Alex Millshttps://oilmanmagazine.com/author/alex-mills/

- Alex Millshttps://oilmanmagazine.com/author/alex-mills/

- Alex Millshttps://oilmanmagazine.com/author/alex-mills/

- Alex Millshttps://oilmanmagazine.com/author/alex-mills/


Oil and gas operations are commonly found in remote locations far from company headquarters. Now, it's possible to monitor pump operations, collate and analyze seismic data, and track employees around the world from almost anywhere. Whether employees are in the office or in the field, the internet and related applications enable a greater multidirectional flow of information – and control – than ever before.