
Laser technology adds efficiency and detail to inspections
When Gabriel Rodriguez arrives at a job site, he has a single focus: get the work done quickly, safely and correctly. In Rodriguez’s work (he’s part of Houston-based TechCorr’s aboveground storage tank inspection team), speed and accuracy sometimes seem mutually exclusive. However, by adopting new technologies for collecting and analyzing tank inspection data, TechCorr has significantly reduced time spent on site. But Rodriguez is not cutting corners; the new approach enables him to capture and deliver far more information than previous methods.
Adhering to Standards
TechCorr conducts tank inspections in accordance with standards established by the American Petroleum Institute (API). The standards specify time intervals between inspections as well as how inspections should be conducted. The work includes extensive physical measurement of a tank’s floor, shell and roof. The measurements are used to look for issues, including out-of-vertical or out-of-roundness of the shell, settlement around the base of the shell, and settlement or depression of the tank floor. Other inspection work tests the thickness of tank walls and floors as well as checking the condition of welds, nozzles and other tank appurtenances. In addition to concerns for safety, regular inspections provide information that help clients maximize the performance and lifetime of a tank.
An out-of-service inspection requires a tank to be emptied and cleaned to allow inspectors to work inside the tank. This downtime, plus additional time for repairs or maintenance revealed by the inspection, can add up quickly. By using lidar (light detection and ranging) technology to save time during the inspection process, TechCorr can increase the value it provides to tank operators.
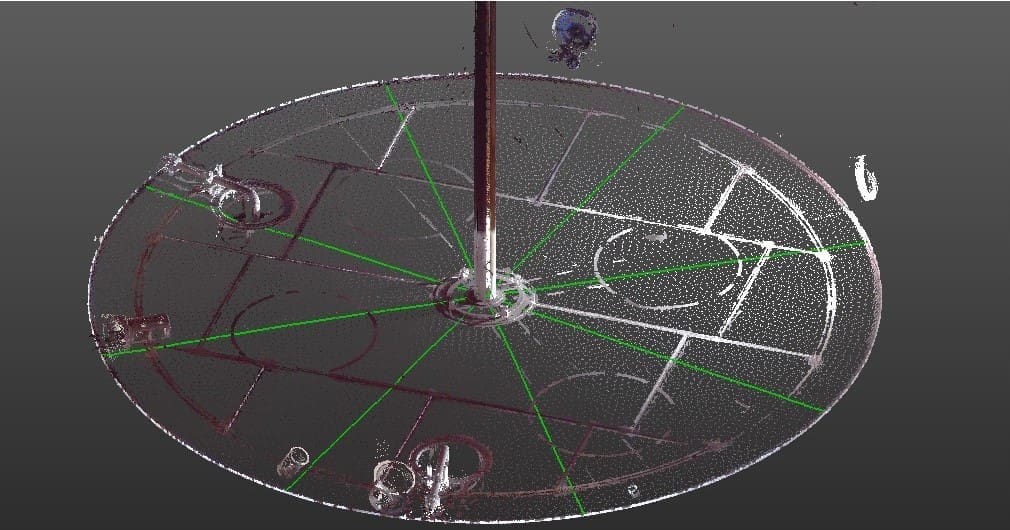
Rodriguez begins each inspection by identifying at least eight stations around the circular tank shell. The API 653 standard calls for a maximum distance of 32 feet (9.7 m) between stations. Large tanks with a diameter of more than 300 feet (91 m) may require more than 30 stations. The stations are defined in diametrically opposed pairs and serve as the basis for measurements on the tank floor and shell.
According to Rodriguez, the traditional approach to the measurement work begins by using a rotating laser level to measure the floor. At each station, Rodriguez walks along a radial line from the shell to the center of the tank, measuring the floor elevation at one-foot intervals. Each reading is recorded by hand. To check the shell, he uses a surveying total station to measure each station, where he captures a series of points on a vertical line from the bottom of the shell up to the roof. He may need to set up the total station in several different locations to gather the needed information.
In the office, the handwritten measurements are entered into spreadsheets to produce finished elevations for the points on the tank floor. Technicians review the numbers to check flatness and look for any settlement or depressions. A similar process handles the total station data, which is analyzed to detect any bulges or departure from vertical. The results are plotted in pairs of opposing stations.
“The work in the field is time-consuming and tedious,” Rodriguez said. “For the verticality data, we need to bring in a second piece of equipment (the total station), which adds to the work. It’s not unusual to spend four hours taking and recording the measurements.” He added that manual data recording introduces the potential for error both in the field and office, so crews must check their work thoroughly. In the office, even using customized spreadsheets, data processing usually takes a few hours before the results can go to CAD operators to prepare finished drawings.
Scanning Allows for Virtual Visits
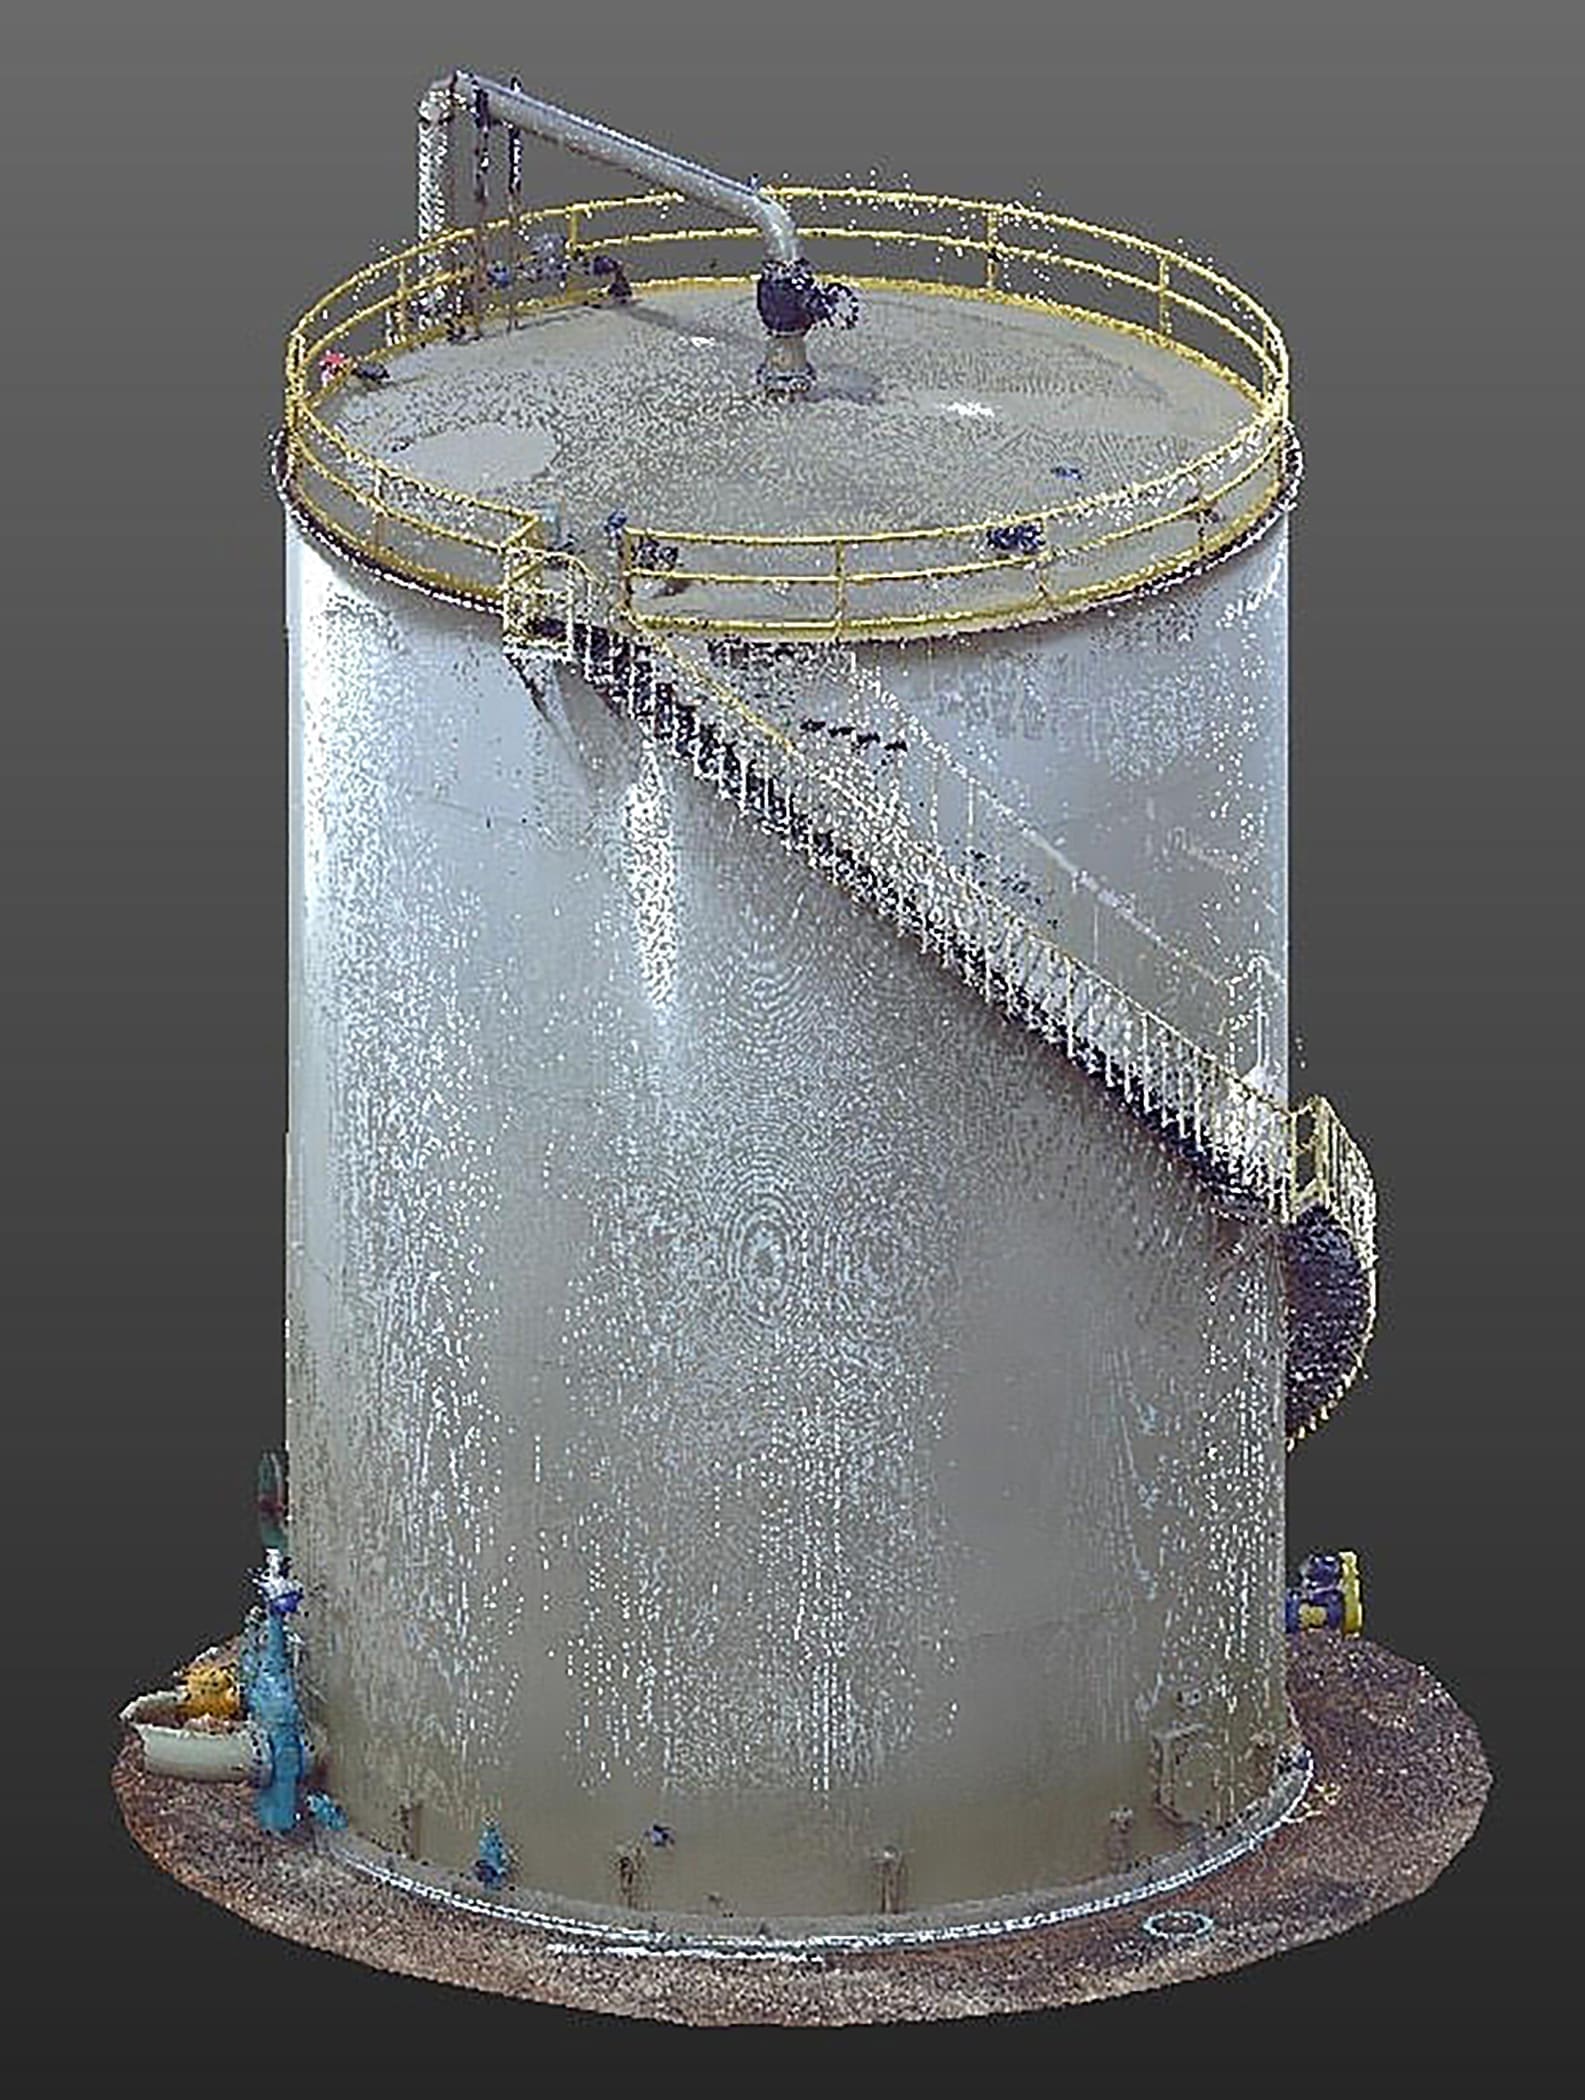
Things change dramatically when TechCorr uses lidar, also known as laser scanning, for tank inspections. Before starting the scanning, Rodriguez walks the area to identify optimal location for the scanner. He said he generally needs four scanner setups to capture a tank interior, although larger tanks may require additional setups—he’s worked in tanks as large as 350 feet (107 m) in diameter.
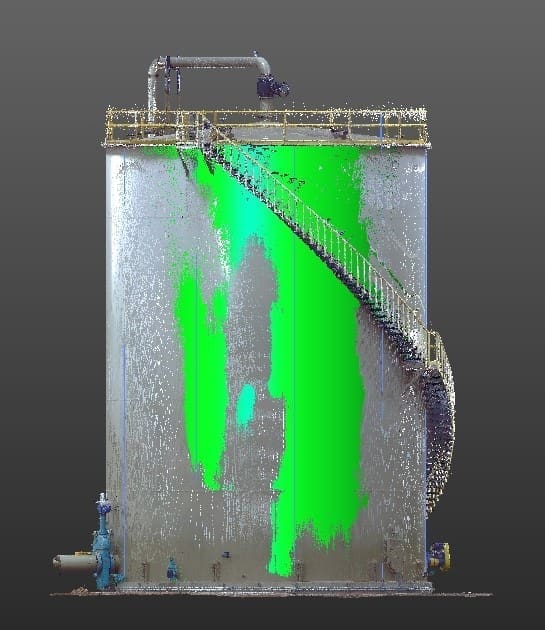
TechCorr uses Trimble TX5 or TX8 3D scanners for the work. The instruments are fully automatic and can measure over one million points per second. Each scan takes about 12 minutes and covers a 360-degree area around the scanner. The measurements capture the tank floor, shell, roof and any piping or structures. The result is a point cloud of tightly spaced 3D points; each point is measured to an accuracy of a few millimeters. Compared to manual measurements, the scanner cuts the time in the field by 75 percent.
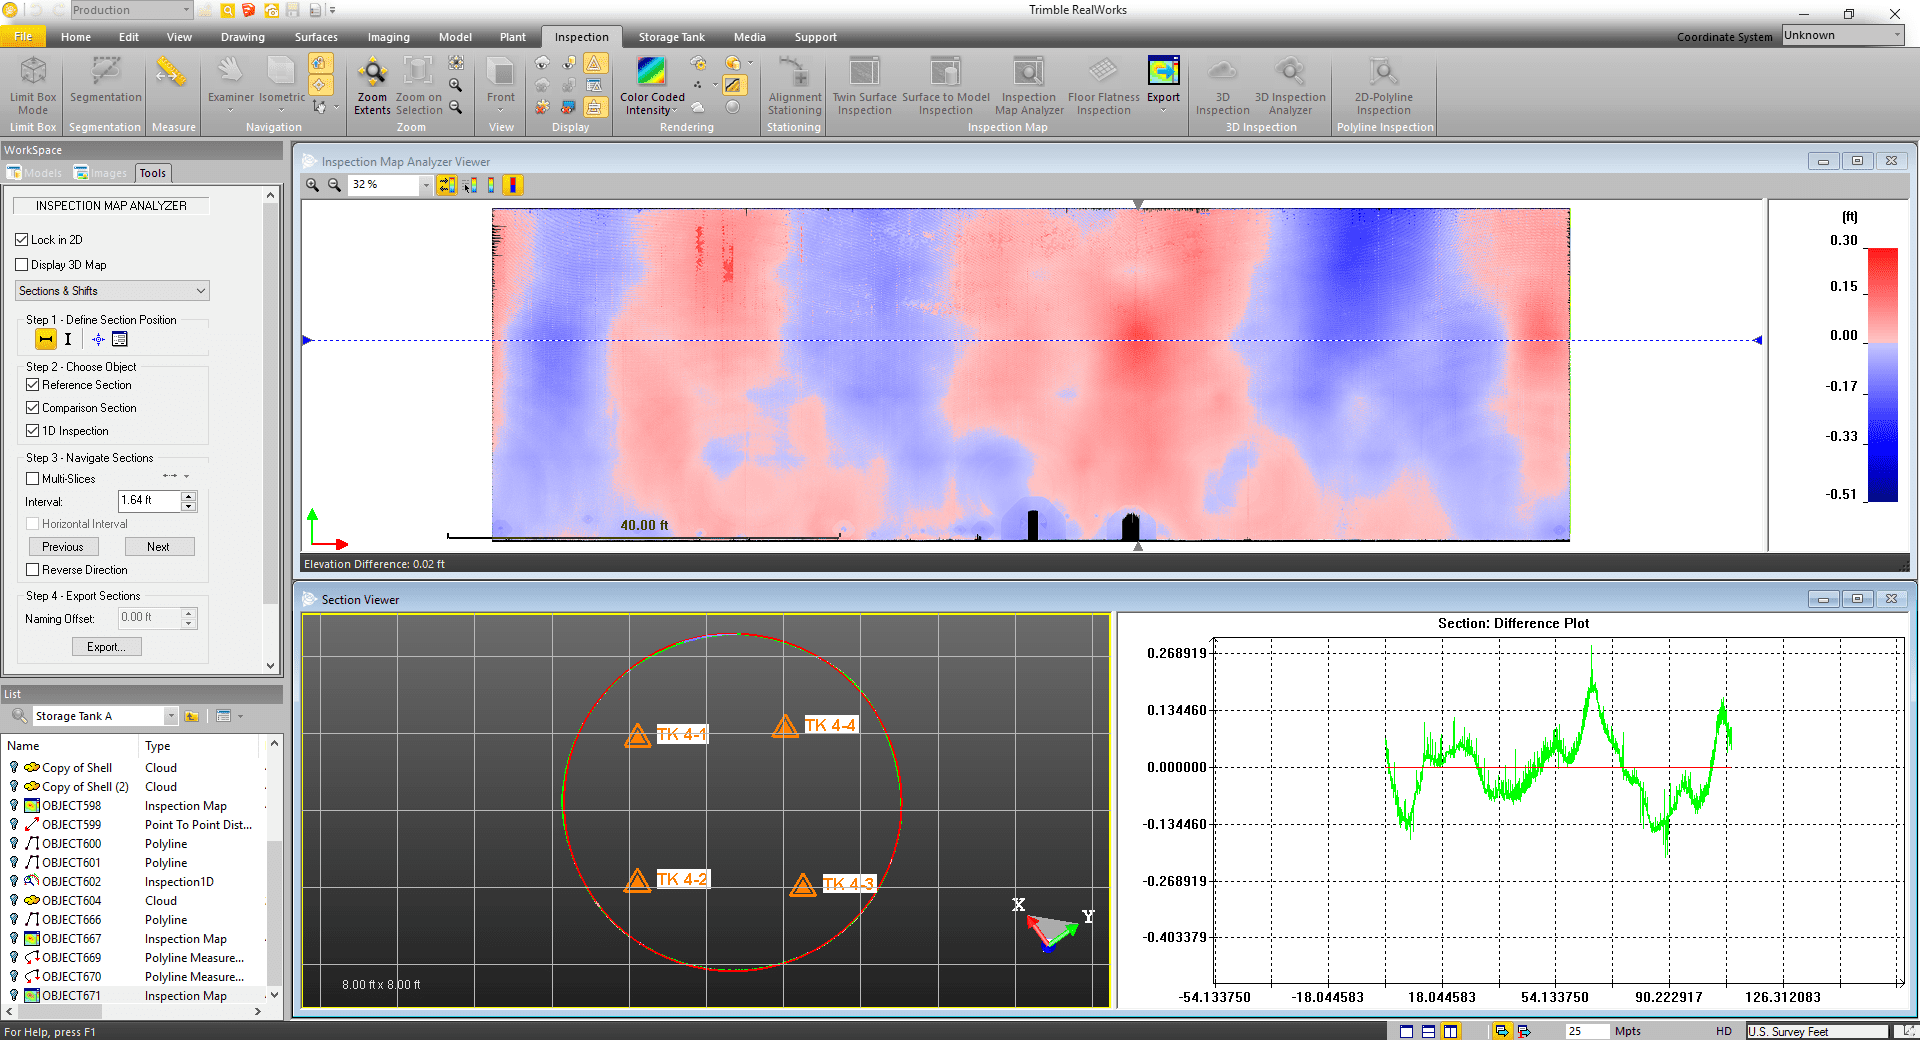
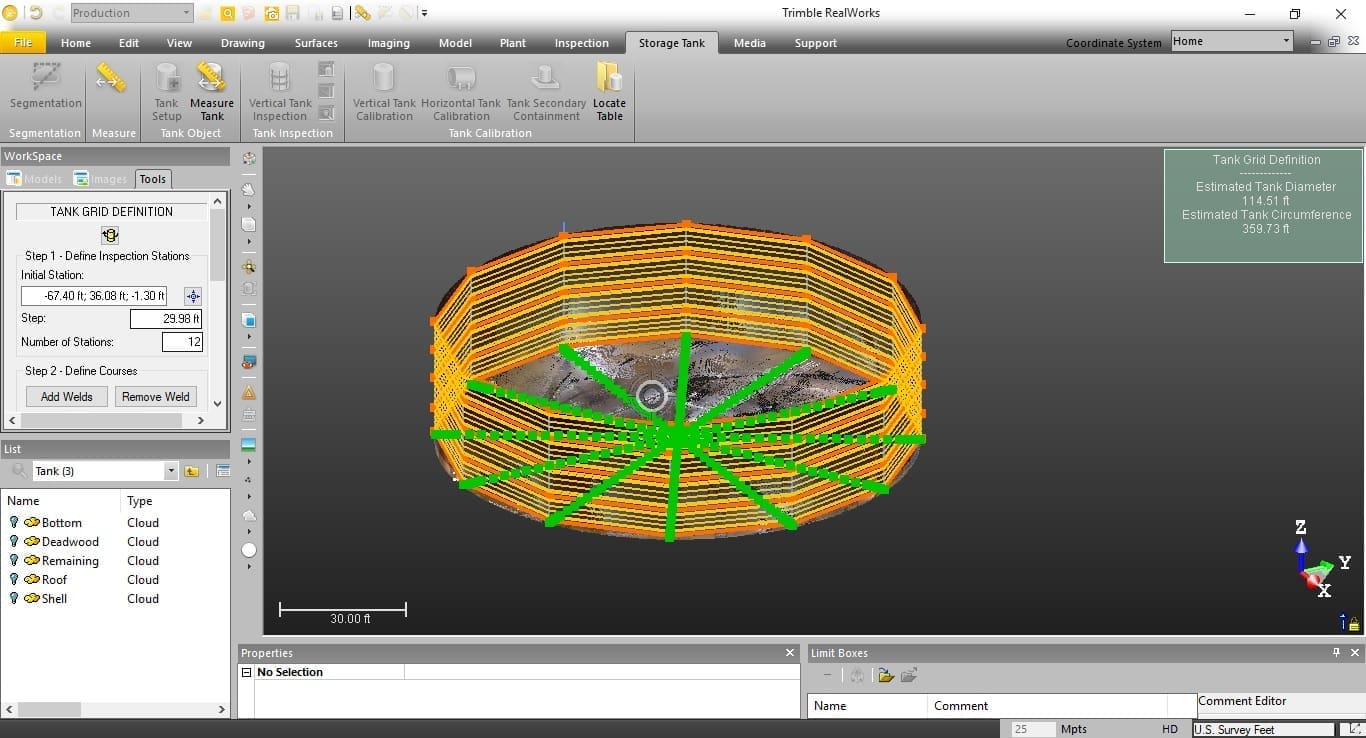
While the savings in the field are significant, Rodriguez believes the larger payoff comes in the office. Data from the scanner is downloaded directly to Trimble RealWorks software. The software then combines (or “registers”) the multiple scans into a single large point cloud. To make viewing easier, the cloud can be colorized using photos taken by the scanner or color information captured with each point. After a bit of cleanup to remove extraneous points—the scanner’s rapid measurement often captures other technicians and their equipment in the area—the finished point cloud is ready for analysis.
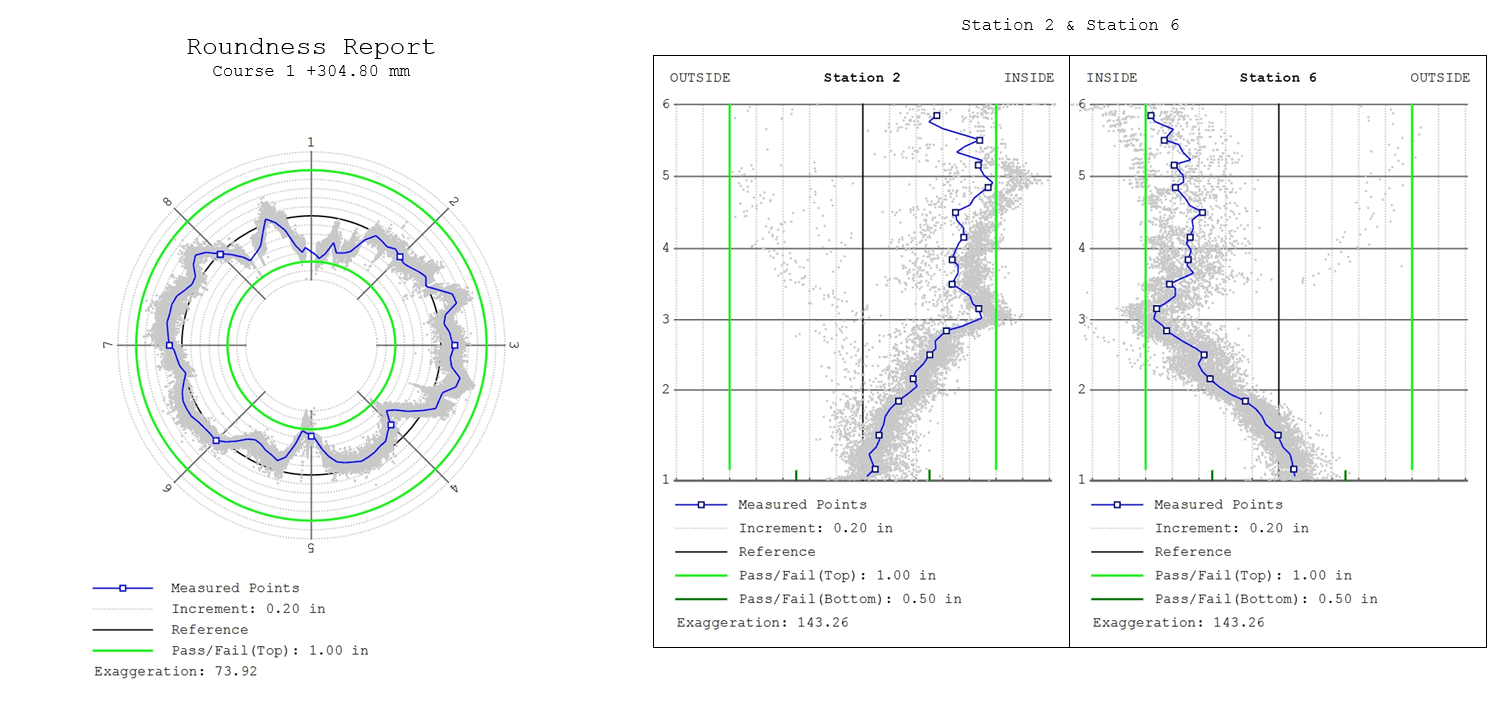
Rodriguez next uses the software to identify the floor, shell and roof as well as interior deadwood such as piping and structural members. He then uses built-in analysis functions for verticality, out-of-roundness and settlement or subsidence around the tank’s edges and floor. He can select the desired stations for verticality analysis and RealWorks will produce the two-station plots equivalent to those created by the manual process. The plots and reports are readily incorporated into the final report that TechCorr provides its clients. In addition to the results of the scanning, TechCorr reports contain information on floor thickness, pitting or corrosion, welds, nozzles and other issues noted by the inspection team. Rodriguez said the automated software saves about half a day in processing compared to the earlier method.
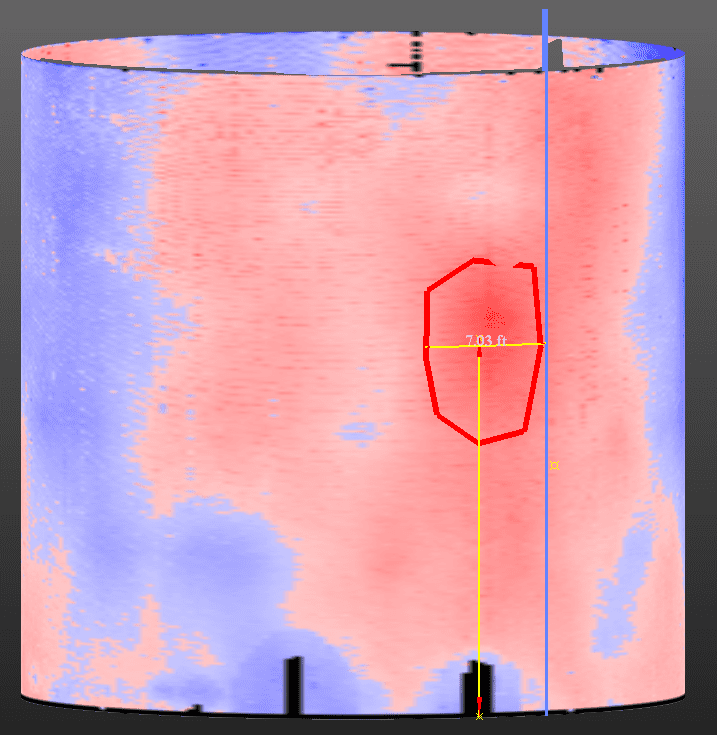
Because scanning captures the entire tank, it can reveal issues that would not show up in a conventional inspection. For example, the software can compare the tank shell to a cylinder to reveal any deformation. It can also fit a plane to the base of the shell to compare the measured floor with a flat surface. “Normally we’re only looking at the eight stations or however many we may have,” Rodriguez said. “With Trimble we’ve captured an entire shell, floor and roof. I can use the geometry, that perfect cylinder, and can point out a deflection between, say stations eight and nine, even though there is no deflection at the stations themselves.” He captures screen snaps of the problem areas to include into reports.
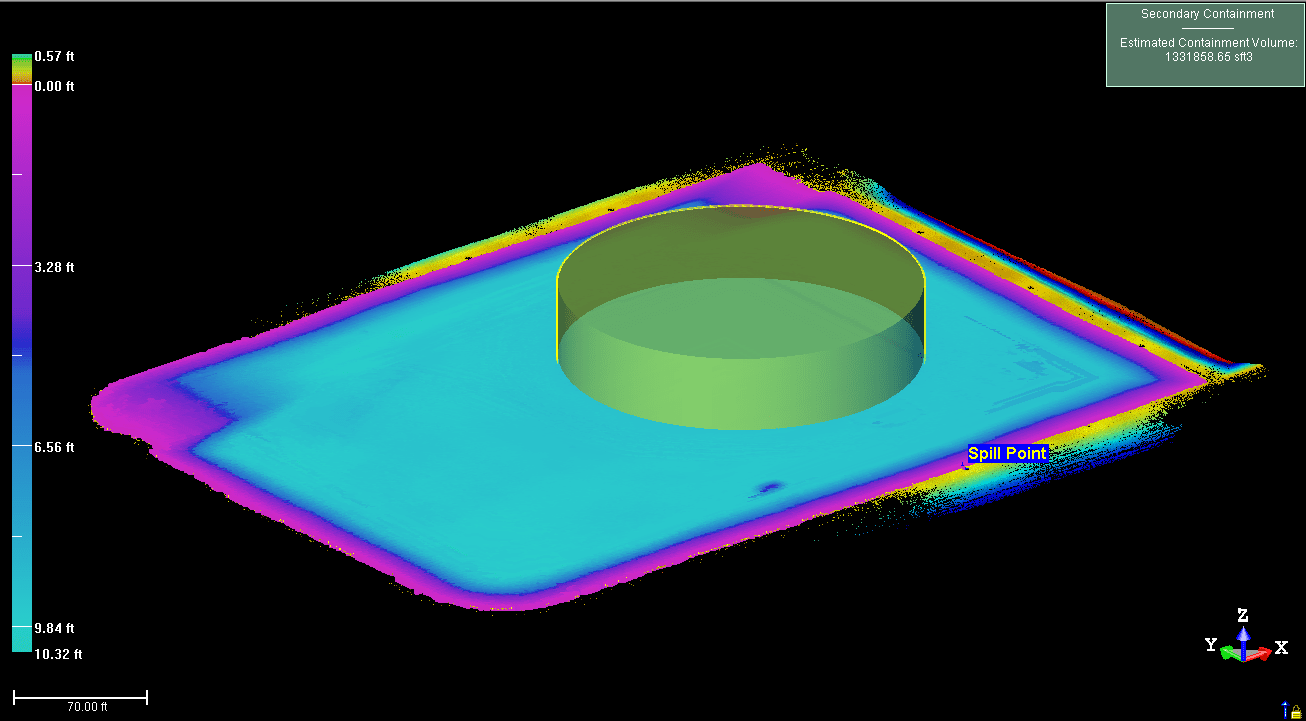
The finished point cloud provides a comprehensive depiction of the tank. As a result, it can be used for other applications. Tank analysis can develop information on capacity and fill levels. Scanning is also used on the exterior of in-service tanks to produce reports on roundness and verticality. The scanners can also capture surrounding conditions, including berms for secondary containments. RealWorks can identify low areas or spill points in the containment berms and then compute the capacity of the containment. The analysis can even account for any expected rainfall and adjust the containment capacity accordingly.
One of the most valuable aspects of scanning is the ability to conduct a virtual revisit at any time. When a client requests additional information or questions a report, technicians can quickly access actual measurements and field data to assess the issue. The capability is especially valuable in assessing tanks that have been returned to service.
The rapid time frame and low costs of scanning create new applications as well. For example, scanning new tanks creates precise baseline data on tank dimensions and capacity. The information can be compared with subsequent scans to assess the tank health and performance. Clients can be supplied with free viewer software to enable them to view their tanks from any angle and make measurements within the point cloud.
In spite of the benefits, not all clients embrace the new technology. TechCorr has developed presentations to illustrate the advantages. “We can display a 3D image of a tank with a virtual walkthrough,” Rodriguez said. “It shows how much more data they can get compared to total stations and rotating lasers. We also explain the free viewer. They can go back years later and see the data as if they were walking through the tank years after the fact.”
While laser scanning helps Rodriguez meet his goals of speed, safety and accuracy, he prefers to focus on the bigger picture, especially in meeting the needs of TechCorr’s customers. “Not only do our reports come out faster, they include much more information than the older reports. We can give our clients more for their money.”

Oil and gas operations are commonly found in remote locations far from company headquarters. Now, it's possible to monitor pump operations, collate and analyze seismic data, and track employees around the world from almost anywhere. Whether employees are in the office or in the field, the internet and related applications enable a greater multidirectional flow of information – and control – than ever before.