

Looking back at 2018, the U.S. oil and gas industry had an exceptional year with respect to merger and acquisition (M&A) transaction activity with a total deal value of nearly $85 billion. By no surprise, the Permian region had the highest value for the fourth year in a row with almost $28 billion in deal value. The next top three regions were: the Multi-Region (which includes deals in more than one region) with close to $12 billion; the U.S. Gulf Coast with just over $11 billion; and the Midcontinent region with $10.5 billion.
Figure 1 shows the breakdown of deals with a disclosed value by region since 2014. Four deals in 2018 had a value of $7 billion or more. The highest valued deal in 2018 was BP buying BHP’s onshore assets for a value of $10.5 billion. The assets are in the Permian, Eagle Ford and Haynesville Basins and included roughly 471,000 net acres.

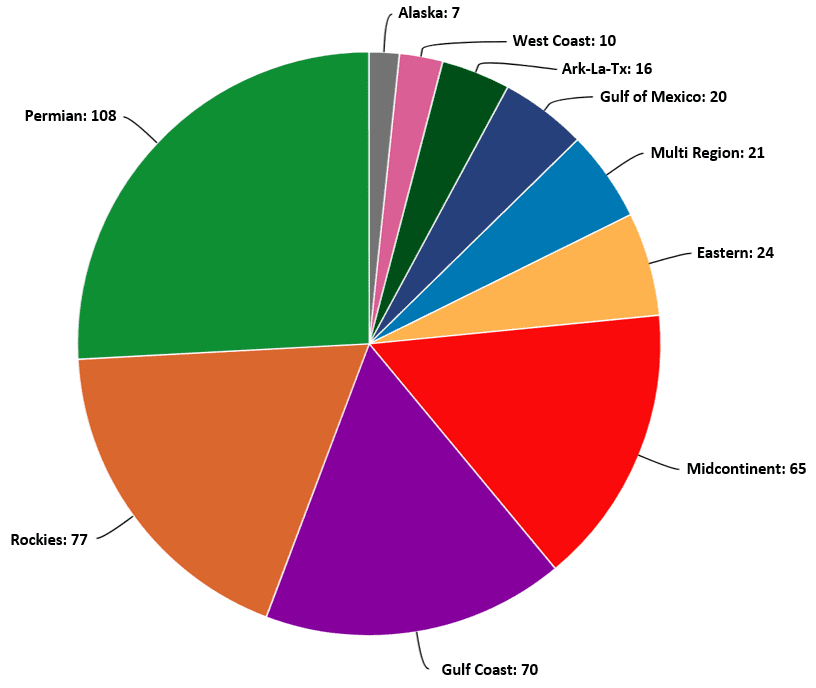
2018 had a reported 418 total deals across the U.S. and Gulf of Mexico. The top four regions account for more than 75% of total transactions for the year. As expected, the Permian remains strong with 26% followed by the Rockies with 19%, the Gulf Coast totaled 17% and the Midcontinent had 15%. Figure 2 shows the breakdown of deals by region.
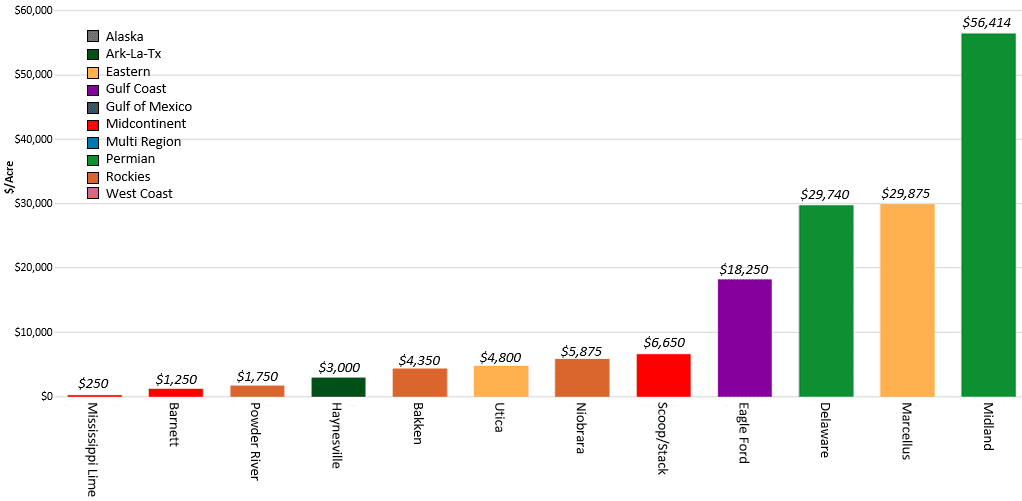
The Midland Basin in 2018 had the biggest dollar/acre value. This is primarily due to Viper Energy buying up royalties. The top plays were the Midland Basin with an average dollar/acre that was $56,414. The next closest play was the Marcellus with $29,875 and the Delaware Basin with $29,740 dollar/acre. Figure 3 shows the breakdown of the dollar/acre on the deals and the play they fall into.
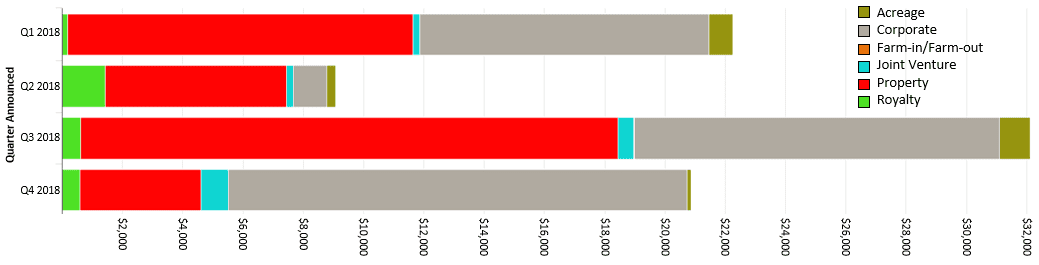
Most of the transactions in 2018 were acreage/property purchases or corporate buyouts. These transactions accounted for about 75% of the deals over the last four quarters. Figure 4 shows the transaction breakouts by deal type (acreage, corporate, joint venture, property and royalty). It is worth noting that property deals are the same as asset deals (Proved Developed Producing or “PDP”, properties and undeveloped acreage), while acreage deals are solely acreage trades.
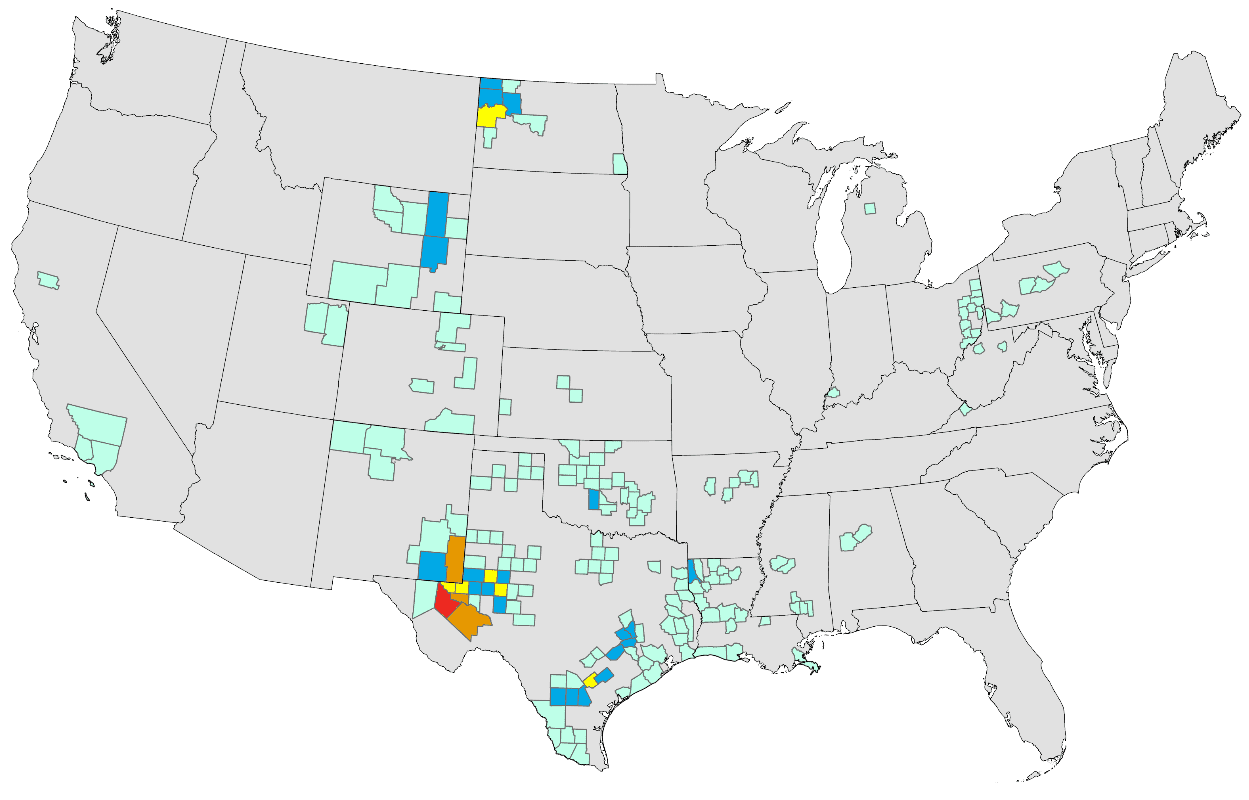
Based on all the deals for 2018, Figure 5 is a heat map showing which counties had the highest number of deals. As expected, based on number of deals, the Permian Basin remains the hot spot for M&A deals in the U.S. Not all deals are represented on Figure 5 due to limited transactional data. Based on trends gleaned from years past, we can expect consolidation in this prolific shale play to continue through 2019 as companies find innovative ways to streamline operations.
Looking ahead into 2019, we expect M&A activity to be slow due to weak oil and gas pricing. As such, we expect more M&A deal activity in 2019 to pick up once crude oil prices reach the $60/bbl-$70/bbl range.

Ryan Long is a Geoscience Technician for Ralph E. Davis Associates, an Opportune LLP company, based in Houston. Prior to joining Ralph E. Davis, he worked for Credit Suisse in the Energy A&D group as a GIS/Geoscience Associate. Prior to Credit Suisse, he worked as a Geoscience Technician in the Deepwater Gulf of Mexico with Venari Resources and on the exploration team in the U.S. Gulf of Mexico and Permian Basin for Apache and Mariner Energy. Ryan earned a Bachelor of Business Administration degree in Business/Commerce at the University of Houston.
- Ryan Longhttps://oilmanmagazine.com/author/ryan-long/


Oil and gas operations are commonly found in remote locations far from company headquarters. Now, it's possible to monitor pump operations, collate and analyze seismic data, and track employees around the world from almost anywhere. Whether employees are in the office or in the field, the internet and related applications enable a greater multidirectional flow of information – and control – than ever before.