

Road transport accounts for over 45% (up to a half) of global use of oil.
In particular, in the United States of America, the most “automobile” country of the world, where national road transport is the most developed (compared to other nations), total length of motorways (paved and unpaved) is over 6.6 million km (some 4.1 million mi), current size of national vehicle fleet exceeds 260 million cars and trucks, and national automobile industry contributes estimated 4-5% of GDP, the share of road transport is over 60% of petroleum consumption. Nearly a third of all refined oil products and crude oil is transported today in the USA by trucks.
Just to compare – in Canada road transportation of petroleum accounts for more than 50% and in Russia – for only 8-9% of shipping crude oil and its products across these countries.
Environmental Aspects
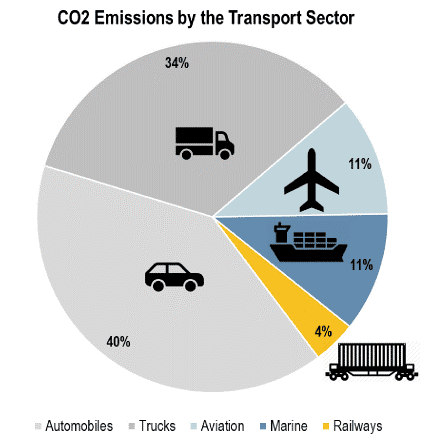
At the same time, transportation is responsible for 24% of direct CO2 emissions from fuel combustion. Road vehicles – cars, trucks, buses and two- and three-wheelers – account for nearly three-quarters of transport CO2 emissions (Figure1).
Transport especially road transport has a strong environmental impact and a variety of measures can be taken to reduce environmental damage by road transport.
The main emissions from motorized road vehicles equipped with spark ignition gasoline engines include carbon monoxide (CO), oxides of nitrogen, unburned hydrocarbon in the exhaust, suspended particulate matter (SPM) and lead aerosols and certain other hydrocarbon emissions.
The most significant emissions from diesel-run vehicles include SPM, oxides of nitrogen, sulphur dioxide, carbon monoxide and hydrocarbons. Both diesel and gasoline-fueled vehicles, particularly the two-stroke gasoline engines, used in two-wheelers and three-wheelers, emit CO2.
Still, according to the International Energy Agency (IEA), global transport emissions of greenhouse gases (GHG) increased in 2018 to 8 gigatonnes of CO2 equivalent (by only 0.6% compared with 1.6% annually growth in the previous decade) owing to efficiency improvements, electrification and greater use of biofuels. And, in line with the Agency’s sustanable development scenario, by 2030 the emissions should decrease down to 7.3 Gt of CO2eq.
The prospects for the industry are quite bright. The fuel ethanol market can be expected to grow a rate of 1.5-1.7% a year during the next decade. The focus will move away from the U.S. and the EU to countries such as Brazil (RenovaBio), China (E-10) and India (E-10).
The EU-28, for instance, tries to achieve net-zero GHG emissions by 2050. Still, current efforts to reduce GHG emissions in Bulgaria, Czechia, Denmark, Estonia, Hungary, the Netherlands, Poland, Portugal and Slovenia are considered by the EU Commission as “insufficient.”
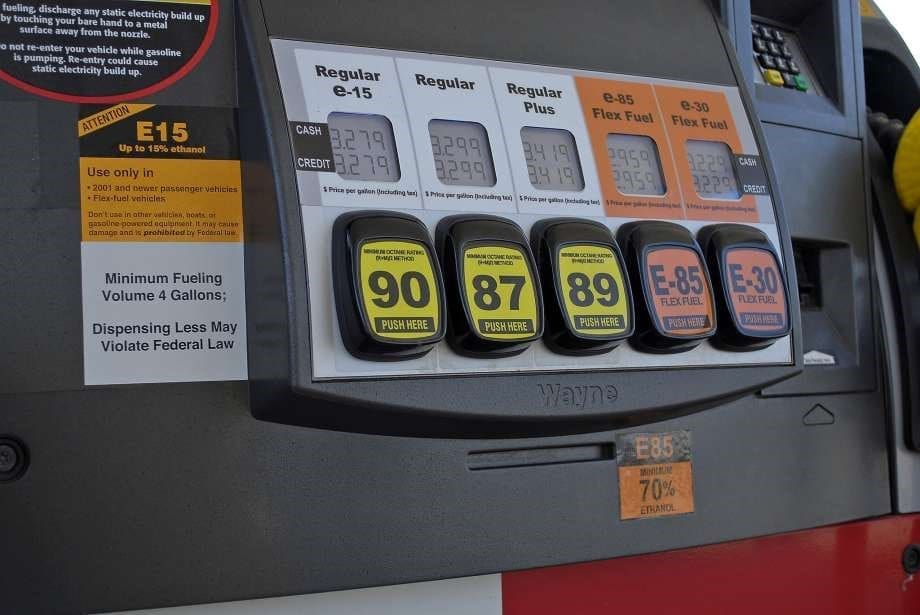
The use of ethanol fuel on the roads should facilitate the reduction in GHG emissions. Although not as highly developed as in Brazil (where every second car now can use ethanol – pure or in mixture with gasoline), the use of gasohol is also quite widespread in the States. Flexible-fuel vehicles (or FFV) can run here on any mixture of ethanol and gasoline up to 85% (E85). Although most E85 use in the USA occurs in the Midwest, where the bulk of ethanol is produced and used, about 3,400 public E85 fueling stations are located around the country, according to the EIA of the U.S. Energy Department.
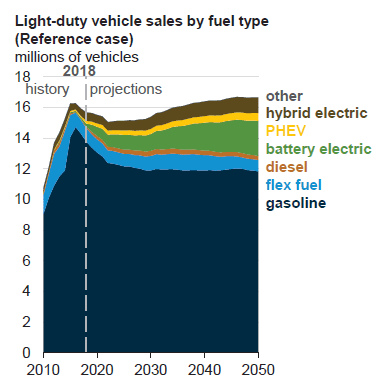
However, annual sales of light-duty flex-fuel vehicles in the States should decline after 2040, according to the EIA’s last outlook (AEO2019, January 2019) due to the projected increase in sales of electric-battery cars (Figure 2).
The following table (Table 1) shows the consumed blending volumes for the various classes of biofuels.

In the framework of its obligations under the Paris Accord, Canada has the objective to achieve 30 megatonnes of annual reductions in GHG emissions by 2030.
In September 2017, China presented a very ambitious growth schedule for the sector: Beijing planned nothing less than a nationwide E-10 mandate by 2020.
In India, which is Asia’s No.2 ethanol producer (after China), the national government remains committed to expanding the role of renewables in transport and the Indian Energy Ministry plans to ban the use of ethanol blends with below 20% spirit content by 2027.
In 2018, approximately 235 million liters of ethanol are forecast to be consumed in Australia as fuel.
Economics
The cost of road shipping of petroleum is quite high – the highest compared to other means of transport, excluding airplanes (rail, pipeline or tanker). Oil products or crude oil are usually carried in the States by large tank trucks with capacities ranging from 5,500 to 11,600 U.S. gallons. New oil tank trucks with their loading/disloading equipment typically cost now $30,000-40,000 per unit.

According to the EIA, in 2017 ton-mile technical costs of oil (crude and products) transportation onshore and offshore the States averaged 4.87 cents for road transport, 0.83¢ – for rail, 0.32¢ – for pipelines, and 0.12¢ – for coastal and river tankers.

Eugene M. Khartukov is a professor at the Moscow State Institute/University for International Relations, (MGIMO), head of the Moscow-based Center for Petroleum Business Studies (CPBS) and of the World Energy Analyses and Forecasting Group (GAPMER), and vice president (for Eurasia) of the Geneva-based Petro-Logistics S.A. He is the author and co-author of over 360 scientific publications and speaker at more than 170 international oil, gas, energy or economic fora. Email: khartukov@gmail.com.
- Eugene M. Khartukovhttps://oilmanmagazine.com/author/eugene-m-khartukov/

- Eugene M. Khartukovhttps://oilmanmagazine.com/author/eugene-m-khartukov/

- Eugene M. Khartukovhttps://oilmanmagazine.com/author/eugene-m-khartukov/

- Eugene M. Khartukovhttps://oilmanmagazine.com/author/eugene-m-khartukov/

- Eugene M. Khartukovhttps://oilmanmagazine.com/author/eugene-m-khartukov/

- Eugene M. Khartukovhttps://oilmanmagazine.com/author/eugene-m-khartukov/

- Eugene M. Khartukovhttps://oilmanmagazine.com/author/eugene-m-khartukov/

- Eugene M. Khartukovhttps://oilmanmagazine.com/author/eugene-m-khartukov/


Oil and gas operations are commonly found in remote locations far from company headquarters. Now, it's possible to monitor pump operations, collate and analyze seismic data, and track employees around the world from almost anywhere. Whether employees are in the office or in the field, the internet and related applications enable a greater multidirectional flow of information – and control – than ever before.