

Despite the dramatic drop of world oil prices in 2014-2016, oil is still the number 1 exported material in the world, with its global export revenues well exceeding in 2017, according to numerous sources, an impressive US$840 billion.
Below are the 15 countries that exported the highest dollar value worth of crude oil during 2017:
- Saudi Arabia: US$133.6 billion (15.9% of total crude oil exports)
- Russia: $93.3 billion (11.1%)
- Iraq: $61.5 billion (7.3%)
- Canada: $54 billion (6.4%)
- United Arab Emirates: $49.3 billion (5.9%)
- Iran: $40.1 billion (4.8%)
- Kuwait: $38.2 billion (4.5%)
- Nigeria: $33 billion (3.9%)
- Angola: $30.5 billion (3.6%)
- Kazakhstan: $26.6 billion (3.2%)
- Norway: $25.9 billion (3.1%)
- Venezuela: $23.1 billion (2.7%)
- United States: $21.8 billion (2.6%)
- Mexico: $19.9 billion (2.4%)
- United Kingdom: $19 billion (2.3%)
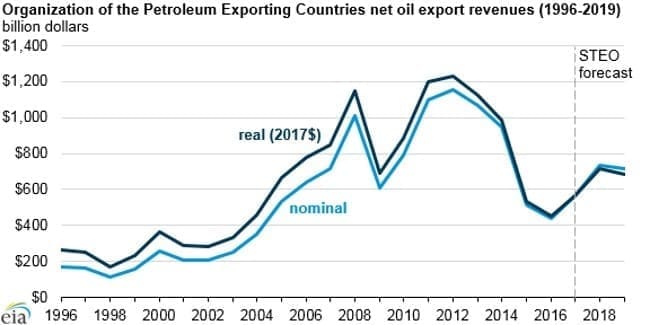
Most of the world’s oil export revenue is surely accounted for by a group of Members of the Organization of the Petroleum Exporting Countries (OPEC), which received about $567 billion in 2017, an increase of 29 percent from revenues in 2016. Increases in both crude oil prices and in net OPEC oil exports increased revenues in 2017, and EIA expects that revenues will continue to increase in 2018, according to EIA’s (Energy Information Administration of the U.S. Energy Department or the U.S. DoE) August Short-Term Energy Outlook. And EIA expects that revenues will continue to increase in 2018, based on EIA’s August Short-Term Energy Outlook.
EIA projects that OPEC net oil export revenues will increase to $736 billion in 2018, up 30 percent from 2017. This expected increase follows higher forecast annual crude oil prices in 2018 and more than offsets slightly lower crude oil production from OPEC members in 2018. OPEC revenues will decline to $719 billion in 2019, according to EIA projections, driven mainly by lower crude oil prices, as well as slightly lower OPEC production and exports.
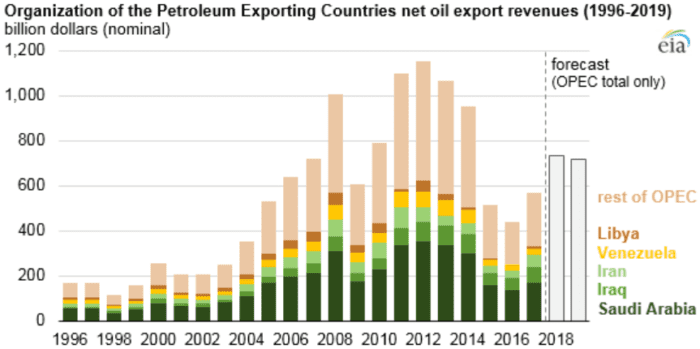
Saudi Arabia, the world’s leading oil exporter, absorbs the majority of the OPEC’s export revenues (nearly: US$134 bn in 2017) (Chart 3).
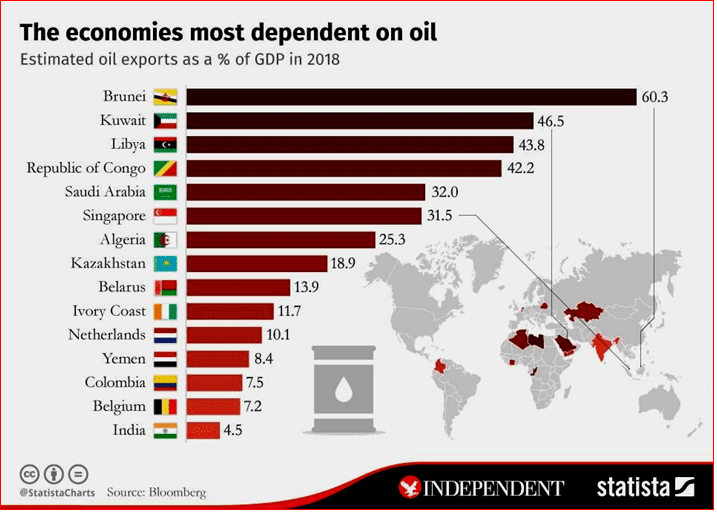
No doubt, oil export receipts play a very important role in the economy of oil-exporting countries, and Saudi Arabia here is far from the first (Chart 4).
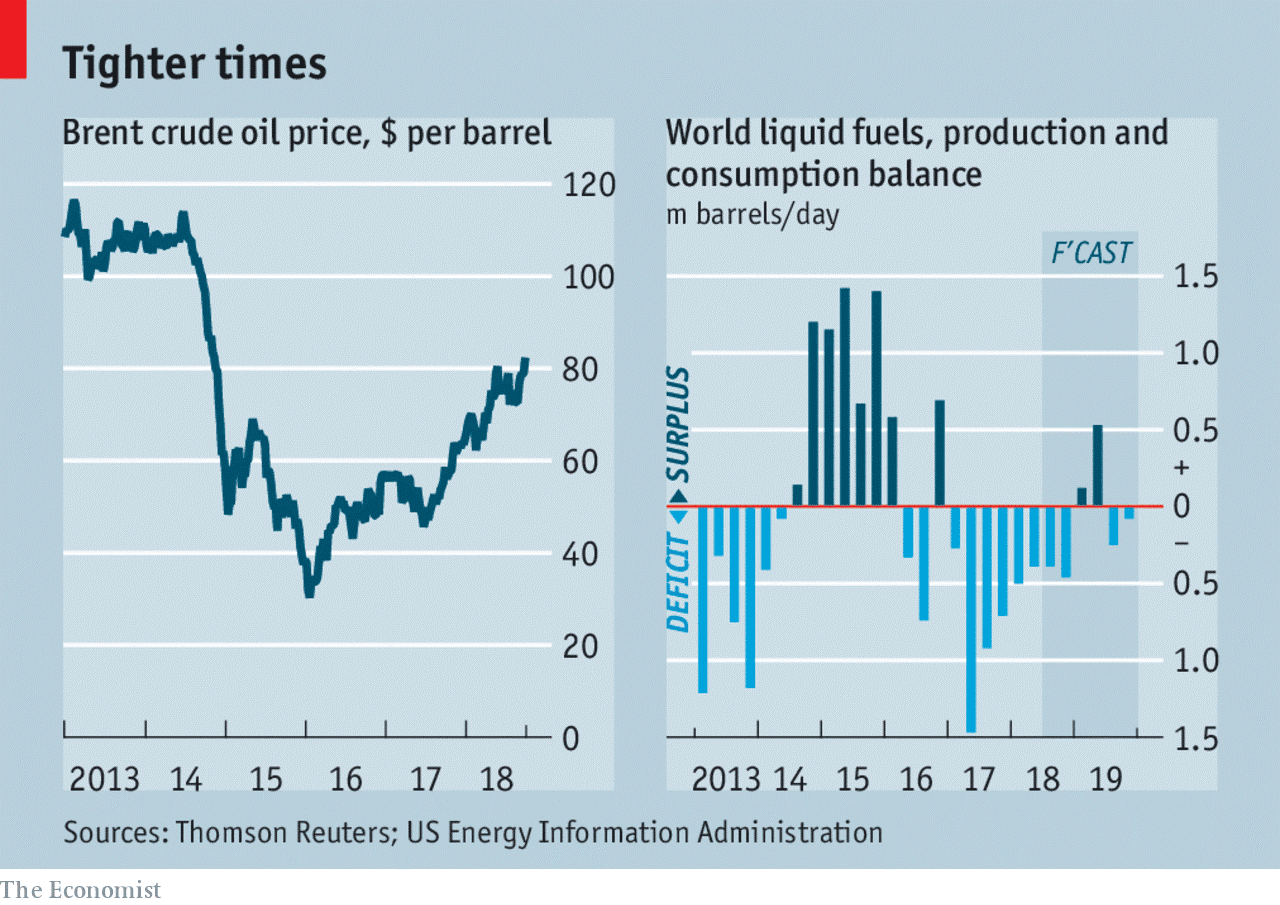
Surely, those are right when attributing oil revenues’ growth not only to the increase in crude oil exports but also to the rise of world oil prices, which rose (as far as European spot prices for Brent are concerned) from some $30/b at the beginning of 2016 to over $80/b at the start of 2019 (Chart 5).
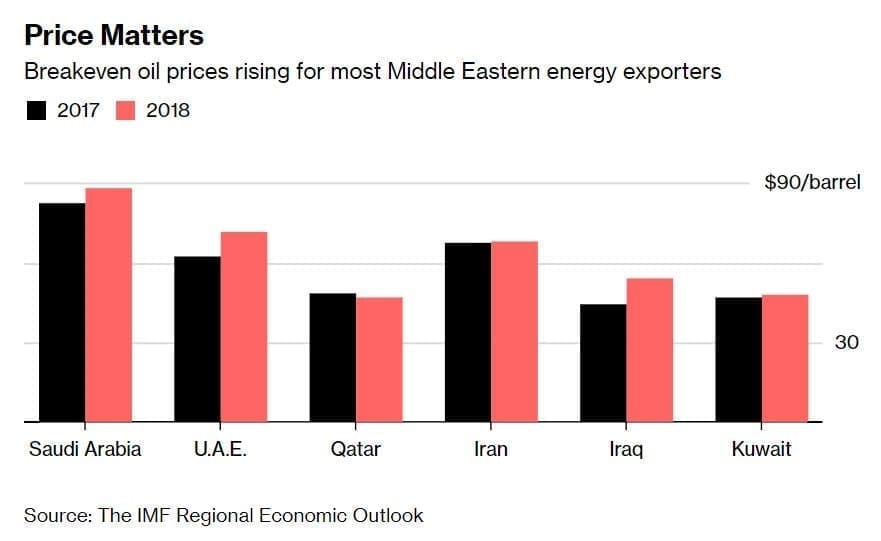
Very close to the topic is the issue of minimum (break-even) budget prices of oil. The point is that oil-exporting countries have accustomed to use their high oil revenues to spend on large purchases and other expenditures and cover (clear) their state budgets with receipts from oil exports. Thus, according to International Monetary Fund’s estimates, budget break-even oil-export price for Saudi Arabia in 2018 amounted to almost $90/b, while for Qatar and Kuwait was around $50/b (Chart 6).
As for Russia, according to ACRA, the Moscow-based Ana-lytic Credit Rating Agency the country could have balanced its federal budget in 2007 at US$26.7/b of average export price of Urals blend, in 2008 – at $57.9/b, while in 2018-2021, in line with the agency’ estimates, this should happen at $48.8-59/b.

Eugene M. Khartukov is a professor at the Moscow State Institute/University for International Relations, (MGIMO), head of the Moscow-based Center for Petroleum Business Studies (CPBS) and of the World Energy Analyses and Forecasting Group (GAPMER), and vice president (for Eurasia) of the Geneva-based Petro-Logistics S.A. He is the author and co-author of over 360 scientific publications and speaker at more than 170 international oil, gas, energy or economic fora. Email: khartukov@gmail.com.
- Eugene M. Khartukovhttps://oilmanmagazine.com/author/eugene-m-khartukov/

- Eugene M. Khartukovhttps://oilmanmagazine.com/author/eugene-m-khartukov/

- Eugene M. Khartukovhttps://oilmanmagazine.com/author/eugene-m-khartukov/

- Eugene M. Khartukovhttps://oilmanmagazine.com/author/eugene-m-khartukov/

- Eugene M. Khartukovhttps://oilmanmagazine.com/author/eugene-m-khartukov/

- Eugene M. Khartukovhttps://oilmanmagazine.com/author/eugene-m-khartukov/

- Eugene M. Khartukovhttps://oilmanmagazine.com/author/eugene-m-khartukov/

- Eugene M. Khartukovhttps://oilmanmagazine.com/author/eugene-m-khartukov/


Oil and gas operations are commonly found in remote locations far from company headquarters. Now, it's possible to monitor pump operations, collate and analyze seismic data, and track employees around the world from almost anywhere. Whether employees are in the office or in the field, the internet and related applications enable a greater multidirectional flow of information – and control – than ever before.